Fig. 1
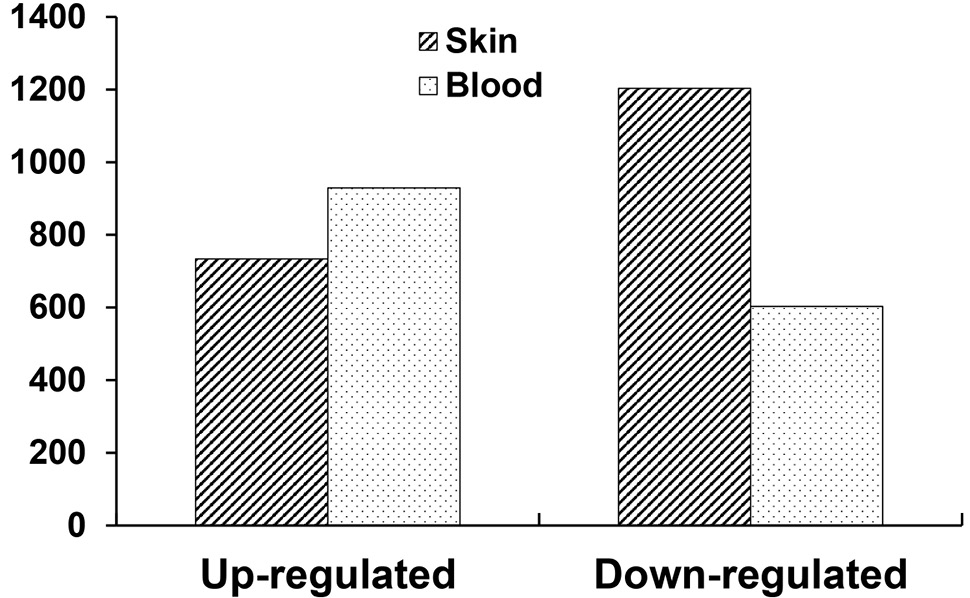
The differentially expressed genes in the skin and blood between two common carp varieties. The y-axis represents the number of differentially expressed genes, and the x-axis represents different tissues.
The differentially expressed genes in the skin and blood between two common carp varieties. The y-axis represents the number of differentially expressed genes, and the x-axis represents different tissues.